Close the 8–12 Point TEDS Gap in Table OCR for Engineers

Expect near-99% character-level accuracy on clean, cropped tables, but structural accuracy (TEDS) is the metric that actually predicts whether your spreadsheet is usable. Lab benchmarks often hit the mid-90s; real documents with mixed layouts commonly fall to the low-to-mid-80s. The single highest-return fix is enforcing 300 to 600 DPI at ingestion, paired with layout-aware parsing and structural repair for large or ambiguous tables.
TL;DR:
- Ensuring 300 to 600 DPI during ingestion significantly improves structural accuracy and reduces table extraction errors, especially for dense or ambiguous layouts.
- Structural metrics like TEDS and TEDS-S are crucial for assessing whether a parsed table is usable, with full-page detection lowering accuracy scores compared to cropped images.
- Common failure modes include merged cells, borderless layouts, multi-row headers, duplicate or missed rows, and skewed images, which require targeted pipeline fixes.
- Improving accuracy involves preprocessing, layout-aware parsing, structural repair, and validation, with each step offering measurable gains before considering model changes.
- Relying solely on benchmark scores on cropped data can be misleading; real-world full-document accuracy often drops 8 to 12 points and needs tailored validation against your documents.
Table of Contents
- Key Accuracy Metrics for Table OCR and What They Measure
- Benchmarks and Typical Accuracy Ranges You Can Expect
- Common Table-Specific Failure Modes and Why They Happen
- Practical Workflow to Improve Table OCR Accuracy in Production
- How to Evaluate and Benchmark OCR Accuracy for Your Documents
- Applied Note: How These Principles Apply to Bank and Statement Tables
- What the Benchmarks Don't Tell You
- Sources
Key Accuracy Metrics for Table OCR and What They Measure
Comparing "OCR accuracy for tables" across vendors is meaningless until you agree on which metric you're reading. Character-level accuracy tells you almost nothing about whether a table's rows and columns landed in the right place.
Tree-Edit-Distance-based Similarity (TEDS) measures how closely a parser's predicted table structure, as an HTML tree, matches the ground truth, scoring both structure and cell text. TEDS-S strips out the text comparison and scores structure alone, which isolates layout errors from transcription errors. Character Error Rate (CER) and Word Error Rate (WER) measure raw transcription accuracy but say nothing about whether a number landed in the right column, so they're poor stand-alone metrics for tabular data. Cell-level precision and recall and structure F1 measure whether individual cells were correctly detected, merged, or split, which matters most for extraction pipelines feeding downstream systems.
Match the metric to the job:
- Analytics and BI feeds: prioritize structure F1 and TEDS-S, since misaligned columns corrupt aggregations silently.
- Accounting totals: prioritize cell-level precision and CER on numeric cells, where a single digit error changes a balance.
- Compliance and audit exports: track completion rate alongside TEDS to confirm no rows were silently dropped.
Benchmarks and Typical Accuracy Ranges You Can Expect
Published benchmarks look impressive until you notice they were run on cropped, pre-isolated table images rather than full documents. On datasets like PubTabNet and FinTabNet, SOTA models exceed 97 TEDS, which is the number most vendor marketing pages quote.
Move to document-context evaluation, where a model has to detect the table on a full page before parsing it, and the numbers drop hard.
On a diagnostic set of real-world tables, the strongest frozen parser scored roughly 85 TEDS overall, an 8 to 12 point gap against cropped-data SOTA scores.
That gap is the entire reason vendor benchmark slides and your production dashboard tell different stories. A few patterns worth internalizing:
- Aggregate TEDS scores in the low 90s can still hide near-total failure on the subset of tables with merged headers or dense borderless layouts.
- Comparative work on complex tabular extraction shows GPT-4o often outperforms smaller vision-language models and many traditional OCR pipelines on structural and layout F1, but "often" is doing real work in that sentence, and results vary by document type.
- A single blended accuracy number rarely tells you whether the failures cluster in a few document types you could fix with targeted preprocessing, or whether they're spread evenly across your whole pipeline.
Treat any single reported accuracy figure as a starting hypothesis to test against your own documents, not a guarantee.
Common Table-Specific Failure Modes and Why They Happen
Most table extraction errors fall into a small number of repeatable patterns. Knowing which one you're looking at tells you which layer of the pipeline to fix.
- Merged-cell misreads. Multi-column headers or merged subtotal rows get split into extra rows or collapsed into one, usually because the parser's visual-token capacity can't represent the merge boundary accurately.
- Borderless layouts. Tables with no visible gridlines rely on whitespace cues that weaken under compression or low contrast, causing rows to bleed into each other.
- Multi-row headers. Two-line column headers frequently get read as a single garbled row or duplicated across both header rows, a classic reading-order problem.
- Duplicate or omitted rows. Large tables that exceed a model's single-pass context often produce dropped rows near page breaks or repeated rows near stitching boundaries.
- Rotation and low-resolution artifacts. Skewed scans or images under 200 DPI degrade character boundaries first, which cascades into column misalignment.
A quick diagnostic: if your output has correct text but wrong row counts, suspect structural failure. If row counts are right but numbers are garbled, suspect resolution or font-rendering issues instead.
Practical Workflow to Improve Table OCR Accuracy in Production
Fix the pipeline in this order. Each stage compounds on the one before it, so skipping preprocessing to chase a fancier model wastes budget.
1. Preprocessing. Enforce 300 DPI as a hard minimum, and push to 400 to 600 DPI for documents with small fonts or dense tables. Moving from 150 to 300 DPI alone can add 15 to 20% accuracy, while going from 300 to 600 DPI adds only 2 to 3% more on small fonts, with diminishing returns past that. Denoise, binarize, and deskew before anything touches a model.
2. Layout-aware parsing. Classic OCR engines like Tesseract handle clean single-column text well but struggle with tables without custom segmentation. A more reliable pattern pairs a supervised detector for table detection with a zero-shot vision-language model for structure recognition, balancing detection reliability against parsing flexibility. Reserve supervised fine-tuning for narrow, high-volume document types where you can justify the labeling cost.
3. Structural repair. For large or ambiguous tables, apply a split-and-merge or Decompose-Enhance-Correct (DEC) style repair pass. DEC-based agentic repair improves average TEDS by 1.57 to 1.89 points across frozen parsers, with gains concentrated on structural errors, up to 5.66 points on large tables specifically. It's a strong lever precisely because it doesn't require retraining your base parser.
4. Postprocessing validation. Apply domain rules (do row sums match a stated total?), normalize numeric formats, and set confidence thresholds that route uncertain cells to human review.
- Reserve manual review budget for the bottom 5 to 10% confidence tier rather than spot-checking randomly.
- Track bookkeeping error patterns over time to see which validation rules catch the most real errors.
Pro Tip: Budget your human-in-the-loop review by confidence score, not by document count. A flat "review every tenth document" policy wastes reviewer time on easy documents while high-risk ones slip through untouched.
How to Evaluate and Benchmark OCR Accuracy for Your Documents
Public benchmarks tell you what's possible; only a test set built from your own documents tells you what to expect. Build one with this sequence:
- Stratify your sample by layout complexity (bordered, borderless, multi-header) and scan quality, not just by document type, since accuracy varies more by layout than by source.
- Size the set for stability. A few dozen documents per stratum is usually enough to get a repeatable metric estimate; smaller samples swing wildly between runs.
- Pick metrics by use case. Use TEDS or TEDS-S for structure-sensitive work, CER or WER for pure transcription tasks, and cell-level precision and recall when the extraction feeds a downstream system directly.
- Set acceptance thresholds at both levels. A form-level pass rate (percentage of documents processed with zero manual correction) matters for cost planning; a field-level accuracy target matters for data quality in downstream reporting.
- Compare against public benchmarks, but never substitute them. Use TEDS-S gaps against your own held-out sample to catch structural weaknesses that cropped-table benchmarks like PubTabNet won't reveal.
Applied Note: How These Principles Apply to Bank and Statement Tables
Taxbatchpro's pipeline was built directly against the failure modes above, not around them. Batch uploads run through image-quality gating before any parsing starts, rejecting or flagging scans below the resolution threshold that reliably preserve numeric columns. Layout-aware parsing is tuned specifically for statement formats: multi-row headers, running balance columns, and merged transaction descriptions that trip up generic table parsers.

Cell validation rules check amount formatting and date consistency before a row gets mapped to a Schedule C category, catching the kind of misalignment that produces a wrong total on an audit-ready export. Following this workflow, readers processing standard bank and credit card statements should expect field-level accuracy in the high 90s on well-scanned documents, with the statement extraction tools built to route anything below that threshold to review rather than silently miscategorizing it. Firms weighing the cost of manual correction against automated conversion can compare options on the pricing page, or test the free statement converter against their own documents before committing to a workflow.
What the Benchmarks Don't Tell You
The industry's obsession with leaderboard TEDS scores has created a blind spot: nobody optimizes for the gap between cropped-table benchmarks and full-document reality, because that gap is uncomfortable to publish. An 8 to 12 point drop between PubTabNet performance and real diagnostic sets isn't a rounding error. It's the difference between a pipeline you can trust with financial data and one that needs a human checking every third row.
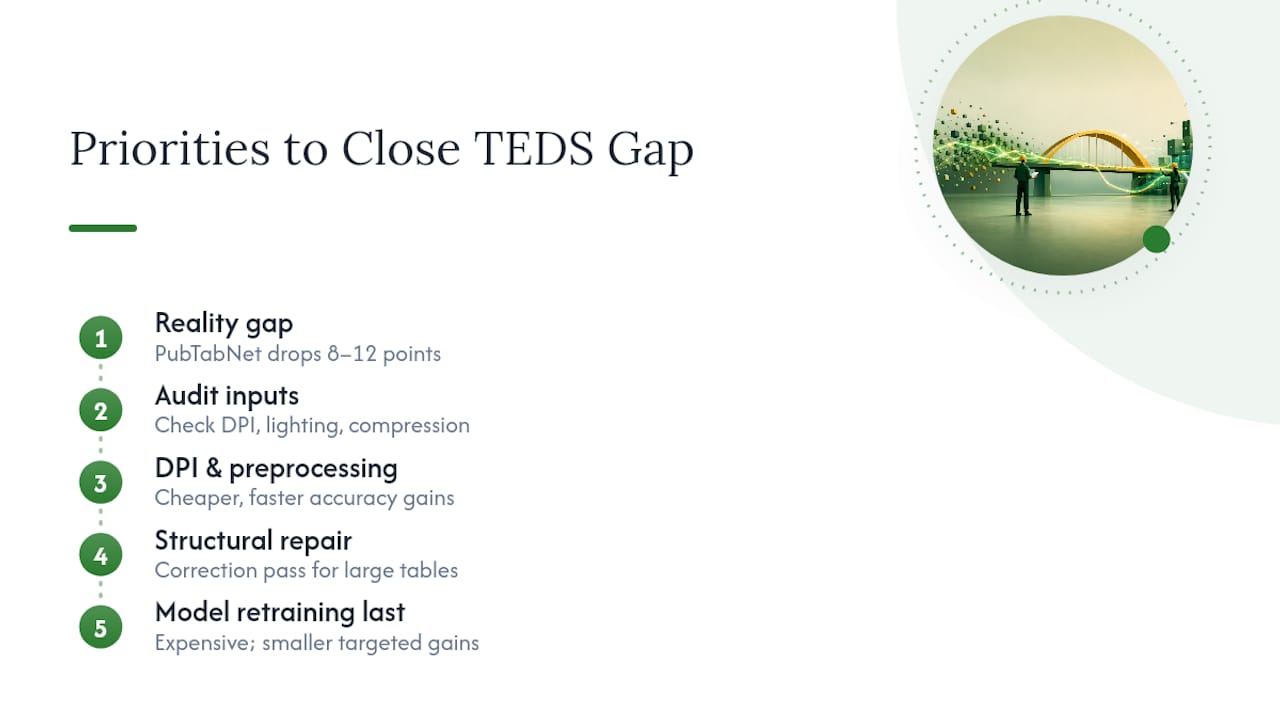
The conventional advice, chase a better model, gets the priority order backwards. DPI and preprocessing fixes are cheaper, faster to deploy, and produce larger accuracy gains than most model swaps, yet they get treated as an afterthought because they're unglamorous. If you take one thing from this piece, audit your input image quality before you audit your model choice.
The second most underrated lever is structural repair. Retraining a parser is expensive and slow; a DEC-style correction pass runs on top of a frozen model and concentrates its gains exactly where document-context tables fail most, on large tables and structural errors. That asymmetry, cheap fix, targeted gain, is what practitioners should prioritize before anything else on this list.
— Ian